Cloudera Databricks Data Science Certification Questions and Answers (Dumps and Practice Questions)
Question : All HadoopExam website subscribers information is stored in the MySQL database,
Which tool is best suited to import a portion of a subscribers information every day as files into HDFS,
and generate Java classes to interact with that imported data?

1. Hive
2. Pig
3. Access Mostly Uused Products by 50000+ Subscribers
4. Flume
Correct Answer : Get Lastest Questions and Answer :
Explanation: Sqoop ("SQL-to-Hadoop") is a straightforward command-line tool with the following capabilities:
" Imports individual tables or entire databases to files in HDFS
" Generates Java classes to allow you to interact with your imported data
" Provides the ability to import from SQL databases straight into your Hive data warehouse
After setting up an import job in Sqoop, you can get started working with SQL database-backed data from your Hadoop MapReduce cluster in minutes.
The input to the import process is a database table. Sqoop will read the table row-by-row into HDFS. The output of this import process is a set of files containing a copy of the imported table. The import process is performed in parallel. For this reason, the output will be in multiple files. These files may be delimited text files (for example, with commas or tabs separating each field), or binary Avro or SequenceFiles containing serialized record data.
A by-product of the import process is a generated Java class which can encapsulate one row of the imported table. This class is used during the import process by Sqoop itself. The Java source code for this class is also provided to you, for use in subsequent MapReduce processing of the data. This class can serialize and deserialize data to and from the SequenceFile format. It can also parse the delimited-text form of a record. These abilities allow you to quickly develop MapReduce applications that use the HDFS-stored records in your processing pipeline. You are also free to parse the delimiteds record data yourself, using any other tools you prefer.
Watch the module : 22 from http://hadoopexam.com/index.html/#hadoop-training
Question : You have run a linear regression model against your data, and have plotted true outcome versus
predicted outcome. The R-squared of your model is 0.75. What is your assessment of the model?
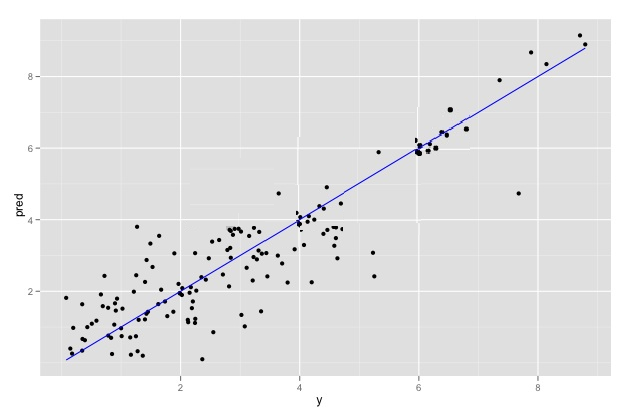
1. The R-squared may be biased upwards by the extreme-valued outcomes. Remove them and
refit to get a better idea of the model's quality over typical data.
2. The R-squared is good. The model should perform well.
3. Access Mostly Uused Products by 50000+ Subscribers
see if the R-squared improves over typical data.
4. The observations seem to come from two different populations, but this model fits them both
equally well.
Correct Answer : Get Lastest Questions and Answer :
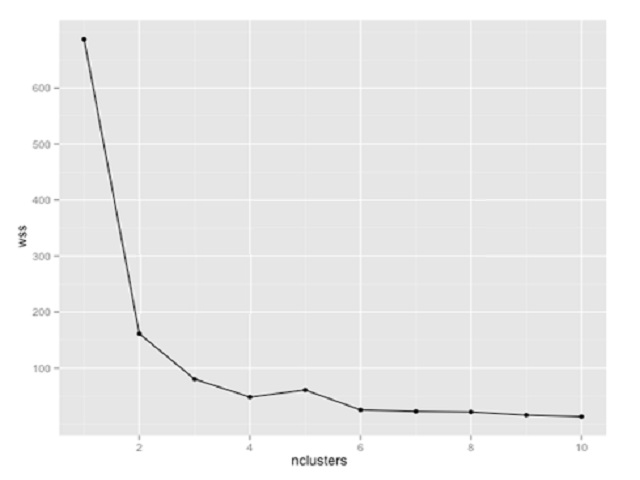
Question : You are using K-means clustering to classify customer behavior for a large retailer. You need to
determine the optimum number of customer groups. You plot the within-sum-of-squares (wss)
data as shown in the exhibit. How many customer groups should you specify?
1. 2
2. 3
3. Access Mostly Uused Products by 50000+ Subscribers
4. 8
Correct Answer : Get Lastest Questions and Answer :
Explanation:
Related Questions
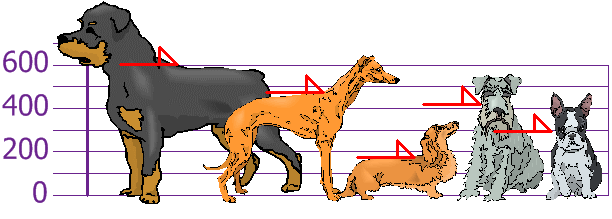
Question : You and your friends have just measured the heights of your dogs (in millimetres):
The heights (at the shoulders) are: 600mm, 470mm, 170mm, 430mm and 300mm.
Find out the Variance
1. 2000
2. 20000
3. Access Mostly Uused Products by 50000+ Subscribers
4. Not enough information to calculate the mean
Question : You and your friends have just measured the heights of your dogs (in millimetres):
The heights (at the shoulders) are: 600mm, 470mm, 170mm, 430mm and 300mm.
Find out the Standard Deviation
1. 147
2. 140
3. Access Mostly Uused Products by 50000+ Subscribers
4. Not enough information to calculate the mean
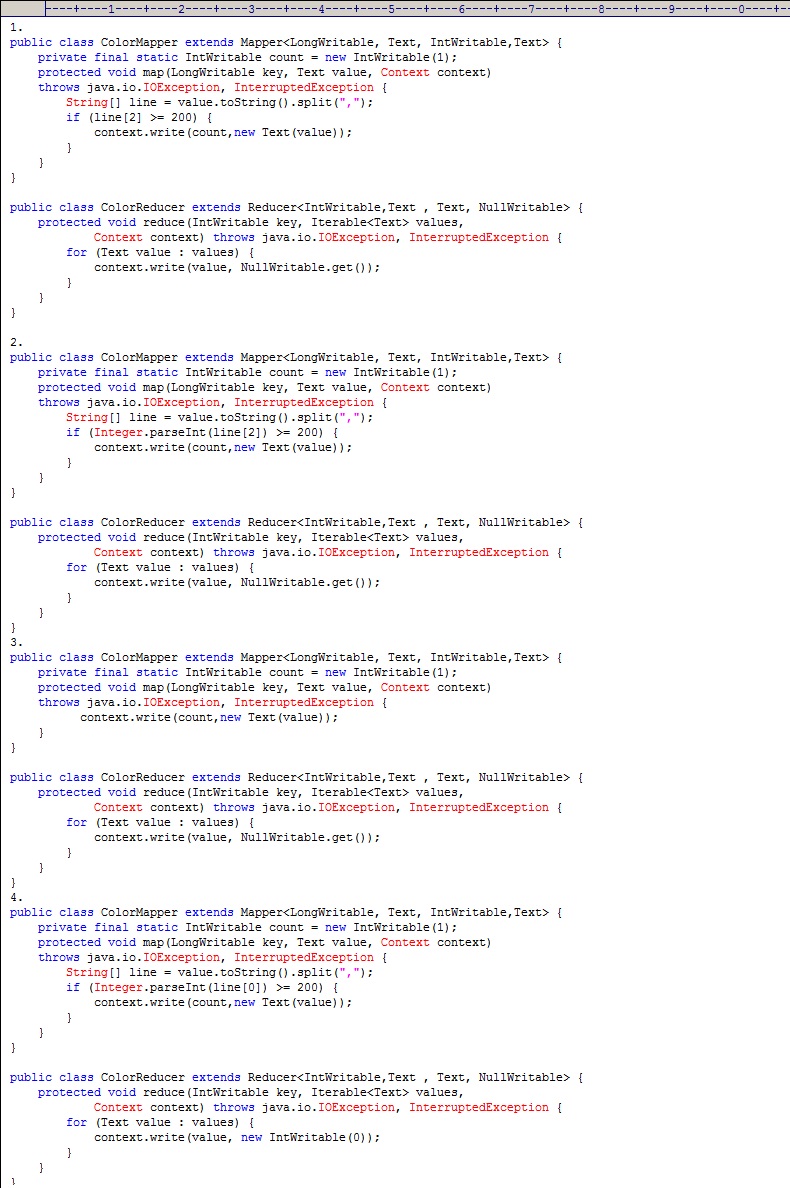
Question :
You have following data in a hive table
ID:INT,COLOR:TEXT,WIDTH:INT
1,green,190
2,blue,300
3,yellow,220
4,blue,199
5,green,199
6,yellow,299
7,green,799
Select the correct Mapper and Reducer which
can produce the output similar to following queries
Select id,color,width from table where width >=200;
1. 1
2. 2
3. Access Mostly Uused Products by 50000+ Subscribers
4. 4
Question :
You have following data in a hive table
ID:INT,COLOR:TEXT,WIDTH:INT
1,green,190
2,blue,300
3,yellow,220
4,blue,199
5,green,199
6,yellow,299
7,green,799
After running thje following MapReduce program, what output it will produces as first line.

1. 1,green,190
2. 4,blue,199
3. Access Mostly Uused Products by 50000+ Subscribers
4. it will through java.lang.ArrayIndexOutOfBoundsException
Question :
You have following data in a hive table
ID:INT,COLOR:TEXT,WIDTH:INT
1,green,190
2,blue,300
3,yellow,220
4,blue,199
5,green,199
6,yellow,299
7,green,799
Select the correct MapReduce program
which can produce the output similar
to below Hive Query.
Select color from table where width >=220;

1. 1
2. 2
3. Access Mostly Uused Products by 50000+ Subscribers
4. 4
Question :
You have following data in a hive table
ID:INT,COLOR:TEXT,WIDTH:INT
1,green,190
2,blue,300
3,yellow,220
4,blue,199
5,green,199
6,yellow,299
7,green,799
Select the correct MapReduce program which
can produce the output similar to below Hive Query.
Select id,color from table where width >=220;

1. 1
2. 2
3. Access Mostly Uused Products by 50000+ Subscribers
4. 4