Cloudera Databricks Data Science Certification Questions and Answers (Dumps and Practice Questions)
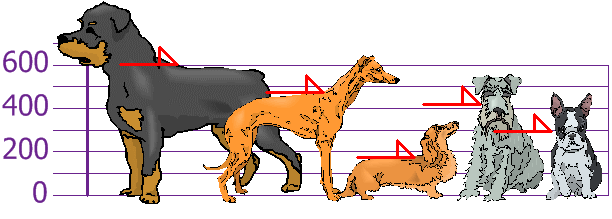
Question : You and your friends have just measured the heights of your dogs (in millimetres):
The heights (at the shoulders) are: 600mm, 470mm, 170mm, 430mm and 300mm.
Find out the Variance
1. 2000
2. 20000
3. Access Mostly Uused Products by 50000+ Subscribers
4. Not enough information to calculate the mean
Correct Answer : Get Lastest Questions and Answer : To calculate the Variance, take each difference, square it, and then average the result
Explanation: Variance = (square(206) + square(76) + square(-224) + square(36) + square(-94))/5
= 108,520/5 = 21,704
Question : You and your friends have just measured the heights of your dogs (in millimetres):
The heights (at the shoulders) are: 600mm, 470mm, 170mm, 430mm and 300mm.
Find out the Standard Deviation
1. 147
2. 140
3. Access Mostly Uused Products by 50000+ Subscribers
4. Not enough information to calculate the mean
Correct Answer : Get Lastest Questions and Answer : To calculate the Variance, take each difference, square it, and then average the result
Explanation: Variance = (square(206) + square(76) + square(-224) + square(36) + square(-94))/5
= 108,520/5 = 21,704
And the Standard Deviation is just the square root of Variance, so: square root of 21,704 = 147.32 = 147
Question :
You have following data in a hive table
ID:INT,COLOR:TEXT,WIDTH:INT
1,green,190
2,blue,300
3,yellow,220
4,blue,199
5,green,199
6,yellow,299
7,green,799
Select the correct Mapper and Reducer which
can produce the output similar to following queries
Select id,color,width from table where width >=200;
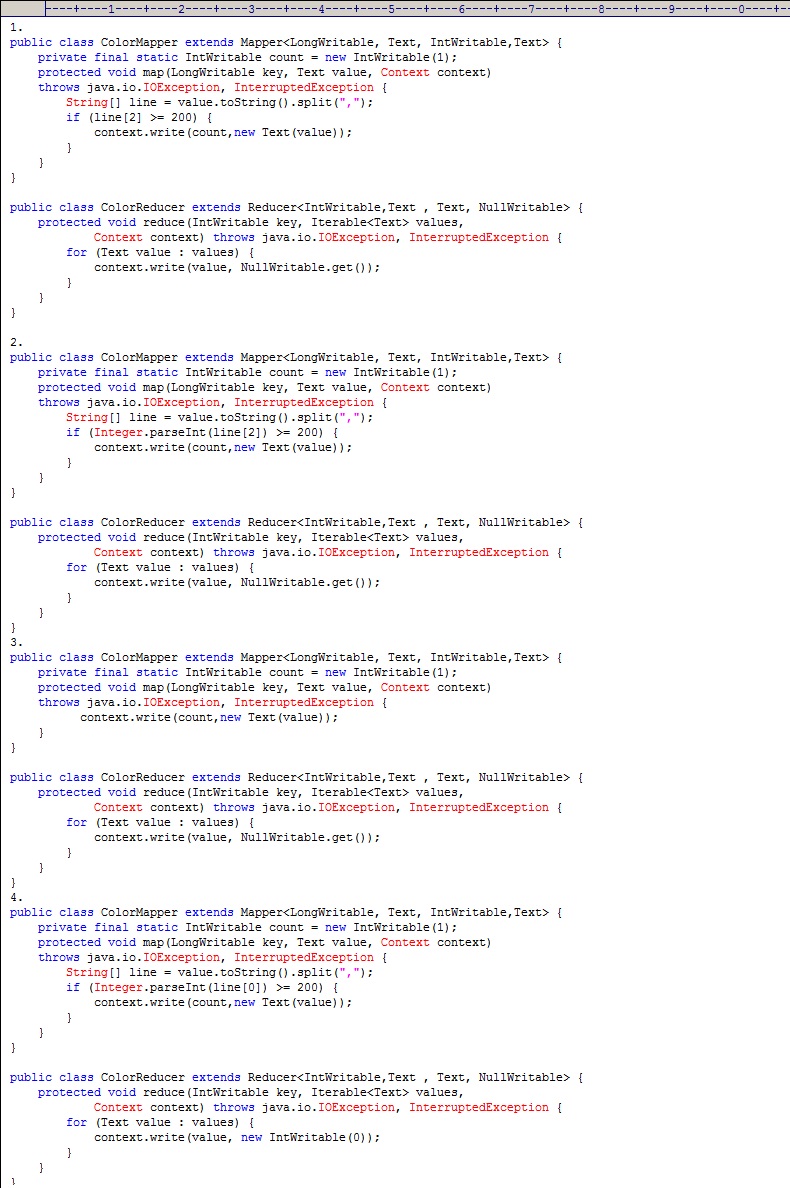
1. 1
2. 2
3. Access Mostly Uused Products by 50000+ Subscribers
4. 4
Correct Answer : Get Lastest Questions and Answer :
Explanation: Option 2 is correct,
Mapper : It iterate over each line in the tables and produce the output like as below from the Mapper which filter out
the records which has width is greater then 200.
Key 1 Value 2,blue,300
Key 1 Value 3,yellow,220
Key 1 Value 6,yellow,299
Key 1 Value 7,green,799
In the reducer part we ignore the key part and emit the value only.
Related Questions
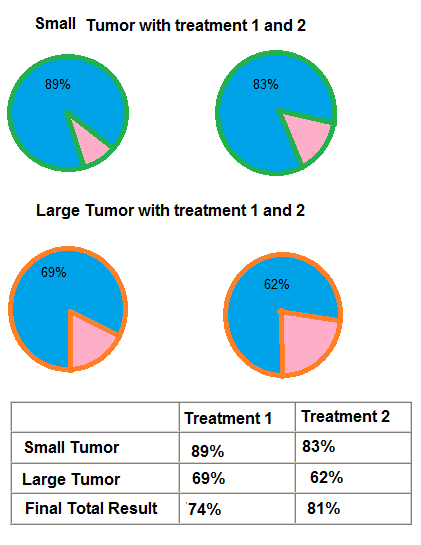
Question :Consider the given table in the image of success rates for two
different treatments of Brain Tumor Cancer for two classes of patients with small tumor and large tumor.
When we look at the treatments overall, treatment 2 has a higher success rate,
but when we look at the treatments for individual patient types,
treatment 1 has a higher success rate. Select the correct statement from below?
1. few patients had large tumor and treatment 2
2. few patients had small tumor and treatment 1
3. Access Mostly Uused Products by 50000+ Subscribers
Question : Consider the given table in the image of success rates for two
different treatments of Brain Tumor Cancer for two classes of patients with small tumor and large tumor.
In case of a large tumor what would we suggest for treatment, treatment 1 or treatment 2.
If we know that a particular patient has large brain tumor, are we better off recommending treatment 1 or treatment 1?
1. Treatment 1, because it has been proven better for patients who are known to have large stones
2. It depends on whether or not we believe the size of the tumor influences the choice of each treatment
3. Access Mostly Uused Products by 50000+ Subscribers
4. We should consider other information about the patient, such as their age and gender, before we make a decision
Question : Consider the given table in the image of success rates for two
different treatments of Brain Tumor Cancer for two classes of patients with small tumor and large tumor.
We get to know that for large timor patients treatment 1 will be used. So in case of small tumor which treatment
should be recommended.
1. Treatment 1, which has proved that small tumor has 89% success ratio.
2. We have to find that the size of the tumor realy metter or not.
3. Access Mostly Uused Products by 50000+ Subscribers
4. As we see totally treatment 2 has been proved better.
Question : Select the correct statement which can be applied to feature selection?
1. May Improve performance of classification algorith006D
2. Classification algorithm may not scale up to the size of the full feature set either in sample or time
3. Access Mostly Uused Products by 50000+ Subscribers
4. Cheaper to collect a reduced set of predictors
5. Safer to collect a reduced set of predictors

1. 1,2,3,4
2. 2,3,4,5
3. Access Mostly Uused Products by 50000+ Subscribers
4. All 1,2,3,4,5
Question :
The method based on principal component analysis (PCA) evaluates the features according to
1. the projection of the largest eigenvector of the correlation matrix on the initial dimensions
2. according to the magnitude of the components of the discriminate vector
3. Access Mostly Uused Products by 50000+ Subscribers
4. None of the above
Question :
mutual information___________
1. can measure arbitrary relations between variables and it do not depend on transformations acting on the different variables.
2. cannot take care of arbitrary relations between the pattern coordinates and the different classes.
3. Access Mostly Uused Products by 50000+ Subscribers
4. None of the above