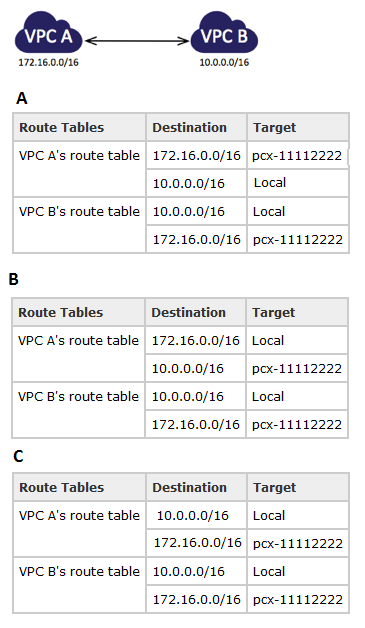
Dell EMC Data Science Associate Certification Questions and Answers (Dumps and Practice Questions)
Question : Which SQL OLAP extension provides all possible grouping combinations?

1. ROLLUP
2. UNION ALL
3. Access Mostly Uused Products by 50000+ Subscribers
4. CROSS JOIN
Correct Answer : Get Lastest Questions and Answer :
Exp: A cube can be considered a multi-dimensional generalization of a two- or three-dimensional spreadsheet. For example, a company might wish to summarize financial data by product, by time-period, and by city to compare actual and budget expenses. Product, time, city and scenario (actual and budget) are the data's dimensions.[3]
Cube is a shortcut for multidimensional dataset, given that data can have an arbitrary number of dimensions. The term hypercube is sometimes used, especially for data with more than three dimensions.
Slicer is a term for a dimension which is held constant for all cells so that multidimensional information can be shown in a two dimensional physical space of a spreadsheet or pivot table.
Each cell of the cube holds a number that represents some measure of the business, such as sales, profits, expenses, budget and forecast.
OLAP data is typically stored in a star schema or snowflake schema in a relational data warehouse or in a special-purpose data management system. Measures are derived from the records in the fact table and dimensions are derived from the dimension tables.
Question : What is the primary bottleneck in text classification?
1. The ability to parse unstructured text data.
2. The availablilty of tagged training data.
3. Access Mostly Uused Products by 50000+ Subscribers
4. The fact that text corpora are dynamic.
Correct Answer : Get Lastest Questions and Answer :
Exp:
Question : Which characteristic applies only to Business Intelligence as opposed to Data Science?
1. Uses only structured data
2. Supports solving "what if" scenarios
3. Access Mostly Uused Products by 50000+ Subscribers
4. Uses predictive modeling techniques
Correct Answer : Get Lastest Questions and Answer :
Exp:
Related Questions
Question : A Data Scientist is assigned to build a model from a reporting data warehouse. The warehouse
contains data collected from many sources and transformed through a complex, multi-stage ETL
process. What is a concern the data scientist should have about the data?

1. It is too processed
2. It is not structured
3. It is not normalized
4. It is too centralized
Question : Which word or phrase completes the statement? Emphasis color is to standard color as _______ .

1. Main message is to key findings
2. Frequent item set is to item
3. Main message is to context
4. Pie chart is to proportions
Question : Which data asset is an example of semi-structured data?
1. XML data file
2. Database table
3. Webserver log
4. News article
Question : Your colleague, who is new to Hadoop, approaches you with a question. They want to know how
best to access their data. This colleague has previously worked extensively with SQL and
databases.
Which query interface would you recommend?
1. Flume
2. Pig
3. Hive
4. HBase
Question : In linear regression, what indicates that an estimated coefficient is significantly different than zero?
1. R-squared near 1
2. R-squared near 0
3. The estimated coefficient is greater than 3
4. A small p-value
Question : Which graphical representation shows the distribution and multiple summary statistics of a
continuous variable for each value of a corresponding discrete variable?
1. box and whisker plot
2. dotplot
3. scatterplot
4. binplot