Cloudera Databricks Data Science Certification Questions and Answers (Dumps and Practice Questions)
Question : Select the correct characteristics of unsupervised learning

1. Unsupervised learning is that of trying to find hidden structure in unlabeled data
2. There is no error or reward signal to evaluate a potential solution
3. Access Mostly Uused Products by 50000+ Subscribers
4. Only 1 and 2
5. All 1,2 and 3
Correct Answer : Get Lastest Questions and Answer :
In machine learning, the problem of unsupervised learning is that of trying to find hidden structure in unlabeled data. Since the examples given to the learner are unlabeled, there is no error or reward signal to evaluate a potential solution. This distinguishes unsupervised learning from supervised learning and reinforcement learning.
Unsupervised learning is closely related to the problem of density estimation in statistics. However unsupervised learning also encompasses many other techniques that seek to summarize and explain key features of the data. Many methods employed in unsupervised learning are based on data mining methods used to preprocess [citation needed] data.
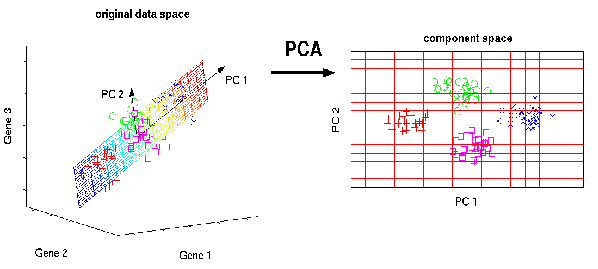
Question : Principal component analysis (PCA) is an example of
1. Supervised learning
2. Unsupervised Learning
3. Access Mostly Uused Products by 50000+ Subscribers
4. Hidden Markov Models
Correct Answer : Get Lastest Questions and Answer :
PCA comes under Unsupervised Learning
Question : Unsupervised learning can be used for bridging the causal gap between input and output observations
1. True
2. False
Correct Answer : Get Lastest Questions and Answer : With unsupervised learning it is possible to learn larger and more complex models than with supervised learning. This is because in supervised learning one is trying to find the connection between two sets of observations. The difficulty of the learning task increases exponentially in the number of steps between the two sets and that is why supervised learning cannot, in practice, learn models with deep hierarchies.
In unsupervised learning, the learning can proceed hierarchically from the observations into ever more abstract levels of representation. Each additional hierarchy needs to learn only one step and therefore the learning time increases (approximately) linearly in the number of levels in the model hierarchy.
If the causal relation between the input and output observations is complex -- in a sense there is a large causal gap -- it is often easier to bridge the gap using unsupervised learning instead of supervised learning. This is depicted in figure 3. Instead of finding the causal pathway from inputs to outputs, one starts building the model upwards from both sets of observations in the hope that in higher levels of abstraction the gap is easier to bridge. Notice also that the input and output observations are in symmetrical positions in the model.
Unsupervised learning can be used for bridging the causal gap between input and output observations. The latent variables in the higher levels of abstraction are the causes for both sets of observations and mediate the dependence between inputs and outputs.
Related Questions
Question :
You have following data in a hive table
ID:INT,COLOR:TEXT,WIDTH:INT
1,green,190
2,blue,300
3,yellow,220
4,blue,199
5,green,199
6,yellow,299
7,green,799
Select the correct MapReduce program which can produce
the output similar to below Hive Query
(Assuming single reducer is configured).
Select color,max(width) from table group by color;

1. 1
2. 2
3. Access Mostly Uused Products by 50000+ Subscribers
4. 4
Question : All HadoopExam website subscribers information is stored in the MySQL database,
Which tool is best suited to import a portion of a subscribers information every day as files into HDFS,
and generate Java classes to interact with that imported data?

1. Hive
2. Pig
3. Access Mostly Uused Products by 50000+ Subscribers
4. Flume
Question As part of HadoopExam consultency team, you have been given a requirement by a Hotel to create
a GUI apllication, so all the hotel's sales or booking you will add and edit the customer information, and you dont want to spend the
money on enterprize RDBMS, hence decided simple file as a storage and considered the csv file. So HDFS is the better choice for
storing such information in the file.
1. No, because HDFS is optimized for read-once, streaming access for relatively large files.
2. No, because HDFS is optimized for write-once, streaming access for relatively large files.
3. Access Mostly Uused Products by 50000+ Subscribers
4. Yes, because HDFS is optimized for write-once, streaming access for relatively large files.
Question : All HadoopExam website subscribers information is stored in the MySQL database,
Which tool is best suited to import a portion of a subscribers information every day as files into HDFS,
and generate Java classes to interact with that imported data?
1. Hive
2. Pig
3. Access Mostly Uused Products by 50000+ Subscribers
4. Flume
Question : You have run a linear regression model against your data, and have plotted true outcome versus
predicted outcome. The R-squared of your model is 0.75. What is your assessment of the model?
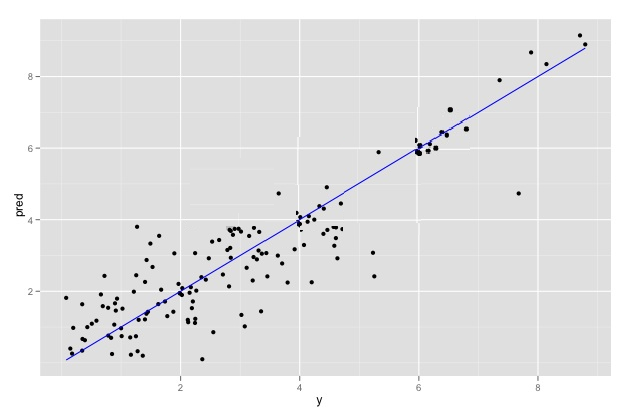
1. The R-squared may be biased upwards by the extreme-valued outcomes. Remove them and
refit to get a better idea of the model's quality over typical data.
2. The R-squared is good. The model should perform well.
3. Access Mostly Uused Products by 50000+ Subscribers
see if the R-squared improves over typical data.
4. The observations seem to come from two different populations, but this model fits them both
equally well.
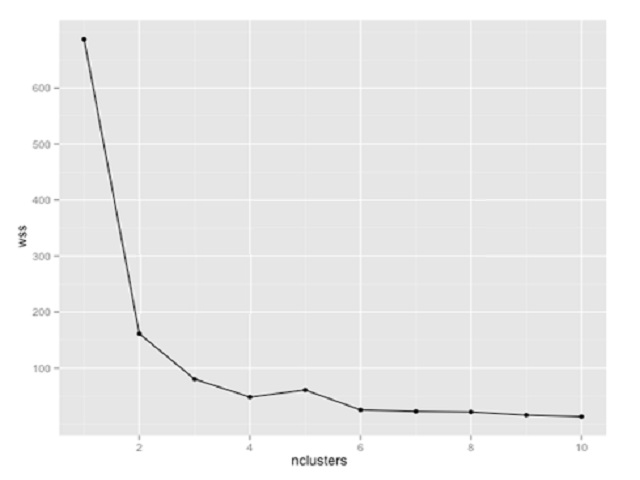
Question : You are using K-means clustering to classify customer behavior for a large retailer. You need to
determine the optimum number of customer groups. You plot the within-sum-of-squares (wss)
data as shown in the exhibit. How many customer groups should you specify?
1. 2
2. 3
3. Access Mostly Uused Products by 50000+ Subscribers
4. 8