Cloudera Databricks Data Science Certification Questions and Answers (Dumps and Practice Questions)
Question : In which of the scenario you can use the regression to predict the values

1. Samsung can use it for mobile sales forecast
2. Mobile companies can use it to forecast manufacturing defects
3. Probability of the celebrity divorce
4. Only 1 and 2
5. All 1 , 2 and 3
Correct Answer : 5
Explanation: Regression is a tool which Companies may use this for things such as sales forecasts or forecasting manufacturing defects. Another creative example is predicting the probability of celebrity divorce.
Question s: RMSE is a good measure of accuracy, but only to compare forecasting errors of different models for a ______, as it is scale-dependent
1. Between Variables
2. Particular Variable
3. Among all the variables
4. All of the above are correct
Correct Answer : 2
The RMSE serves to aggregate the magnitudes of the errors in predictions for various times into a single measure of predictive power. RMSE is a good measure of accuracy, but only to compare forecasting errors of different models for a particular variable and not between variables, as it is scale-dependent.
Question : You are creating a Classification process where input is the income, education and
current debt of a customer, what could be the possible output of this process.
1. Probability of the customer default on loan repayment
2. Percentage of the customer loan repayment capability
3. Percentage of the customer should be given loan or not
4. The output might be a risk class, such as "good", "acceptable", "average", or "unacceptable".
5. All of the above
Correct Answer : 4
Classification is the process of using several inputs to produce one or more outputs. For example the input might be the income, education and current debt of a customer. The output might be a risk class, such as "good", "acceptable", "average", or "unacceptable". Contrast this to regression where the output is a number, not a class.
Related Questions
Question :
Select the correct objectives of principal component analysis
1. To reduce the dimensionality of the data set
2. To identify new meaningful underlying variables
3. Access Mostly Uused Products by 50000+ Subscribers
4. Only 1 and 2
5. All 1, 2 and 3
Question :
Select the correct objectives of principal component analysis
1. Reducing the original variables into a lower number
2. Visulizing correlations among the original variables
3. Access Mostly Uused Products by 50000+ Subscribers
1. 1,2
2. 1,3
3. Access Mostly Uused Products by 50000+ Subscribers
4. 1,2,3
Question : Principal component analysis aims to
1. summarize data with many independent variables to a smaller set of derived variables
2. In such a way, that first component has maximum variance, followed by second, followed by third and so on
3. Access Mostly Uused Products by 50000+ Subscribers
4. All of the above
Question :
You have collected the 100's of parameters about the 1000's of websites e.g. daily hits, average time on the websites,
number of unique visitors, number of returning visitors etc. Now you have find the most important parameters
which can best describe a website, so which of the following technique you will use
1. PCA (Principal component analysis)
2. Linear Regression
3. Access Mostly Uused Products by 50000+ Subscribers
4. Clustering
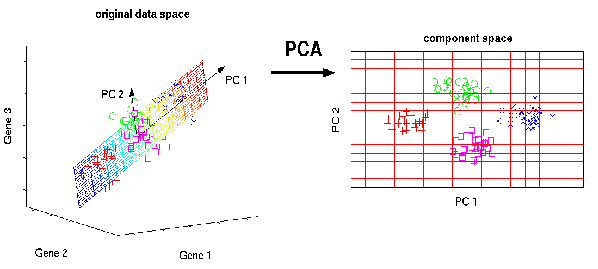
Question : Principal component analysis (PCA) is a statistical procedure
that uses an orthogonal transformation to convert a set of observations
of possibly correlated variables into a set of values of linearly uncorrelated variables
called principal components. Which of the below best describe the Principal component analysis
1. Dimensionality reduction
2. Collaborative filtering
3. Access Mostly Uused Products by 50000+ Subscribers
4. Regression
5. Clustering
Question :
Which of the below best describe the Principal component analysis
1. It is a way of identifying patterns in data
2. expressing the data in such a way as to highlight their similarities and differences
3. Access Mostly Uused Products by 50000+ Subscribers
4. Only 1 and 3
5. All 1,2 and 3